Webhook adapters
Prometheus Alertmanager
Send Alertmanager groups to WarnFire, page once per problem, and close incidents automatically when the group recovers.
WarnFire accepts Prometheus Alertmanager webhook notifications. A firing group opens an incident and starts its escalation policy. Updates to that group update the same incident. When the group resolves, WarnFire closes it.
Alerts, not logs or metrics. WarnFire receives notifications from Alertmanager. It does not scrape Prometheus, query dashboards, or ingest application logs through this adapter.
The configuration and lifecycle on this page are tested end to end with a real Alertmanager v0.28.0 sender.
Before you begin
You need:
- a WarnFire service and an integration key for this Alertmanager installation, created with the Prometheus Alertmanager alert source. A key works only for its own source. If you do not have one, create the service and its first key ;
- access to the Alertmanager configuration and secret files; and
- permission to validate and reload Alertmanager.
Create a separate WarnFire service and key for each monitoring tool. A service named Checkout (Alertmanager) is immediately distinguishable from Checkout (Grafana) when you are responding at 3am.
Five-minute setup
1. Store the integration key
Put only the key in a file readable by Alertmanager:
install -d -m 700 /etc/alertmanager/secrets
printf '%s' 'wf_live_your_integration_key_here' > /etc/alertmanager/secrets/warnfire-key
chmod 600 /etc/alertmanager/secrets/warnfire-key
Do not put the key in the webhook URL or commit it with the Alertmanager configuration.
If Alertmanager runs in Docker, mount the containing directory rather than the individual file:
volumes:
  - ./secrets:/etc/alertmanager/secrets:ro
Creating a missing file through a Docker bind mount can produce a root-owned directory with the same name. Mounting the containing directory makes a missing key fail clearly.
2. Add the WarnFire receiver
route:
  receiver: warnfire
  group_by: [service]
  group_wait: 10s
  group_interval: 30s
  repeat_interval: 1h

receivers:
  - name: warnfire
    webhook_configs:
      - url: https://api.warnfire.com/v1/integrations/webhooks/alertmanager
        send_resolved: true
        http_config:
          authorization:
            type: Bearer
            credentials_file: /etc/alertmanager/secrets/warnfire-key
Alertmanager’s webhook receiver currently defaults send_resolved to true. Keep it explicit: an inherited or copied false leaves incidents open after the monitoring condition clears.
Alertmanager does not expand shell environment variables in this YAML. Write the WarnFire URL literally or render the configuration before Alertmanager reads it.
3. Validate and reload
amtool check-config /etc/alertmanager/alertmanager.yml
kill -HUP "$(pidof alertmanager)"
For Docker Compose, use docker compose restart alertmanager if you do not send SIGHUP inside the container.
Decide what one incident means
Alertmanager sends a notification group, not a stream of unrelated individual webhooks. WarnFire correlates that group using Alertmanager’s groupKey:
Alertmanager member alerts → one Alertmanager group → one WarnFire incident
Your group_by labels determine the group and therefore the incident boundary.
route:
  group_by: [service, environment]
Choose labels that name the thing responders handle together:
| Grouping | Incident boundary |
|---|---|
[service] | One incident per service |
[service, environment] | One incident per service and environment |
[cluster, service] | One incident per service and cluster |
[alertname] | One incident per alert-rule symptom |
Grouping by alertname is appropriate only when every alert rule truly deserves a separate response. Otherwise one outage that triggers latency, error-rate, and health-check rules becomes three incidents and three pages.
Put every grouping label on every relevant rule. A checkout rule without service: checkout cannot join the checkout group.
groups:
  - name: checkout
    rules:
      - alert: CheckoutHighErrorRate
        expr: rate(http_requests_total{service="checkout",status=~"5.."}[5m]) > 0.05
        for: 2m
        labels:
          service: checkout
          environment: production
          severity: critical
          component: checkout-api
        annotations:
          summary: Checkout is failing
          description: More than 5% of checkout requests are failing.
          runbook_url: https://runbooks.example.com/checkout
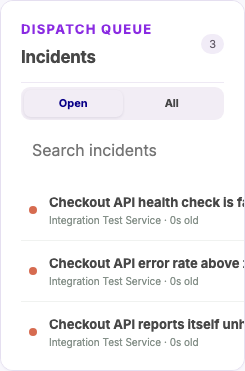
Grouping by alertname: three symptoms become three incidents.
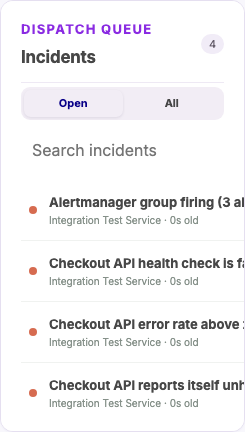
After switching to group_by: [service], one fresh notification creates one
incident for all three alerts. The three earlier alertname test incidents
remain below it because grouping changes do not merge incidents that already
exist.
What happens during a group lifecycle
Suppose a service group contains a critical error-rate alert and two warning alerts:
| Delivery | Member state | WarnFire behavior |
|---|---|---|
| Initial firing notification | Three firing members | Open one incident and page according to its escalation policy |
| Changed firing notification | Critical resolved; two warnings firing | Update the same incident and reduce its severity to warning |
| Final resolved notification | Every member resolved | Resolve the same incident and stop escalation |
| Identical retry | No state changed | Treat it as an idempotent retry; do not create another incident |
Acknowledging the incident is a human-response action. It does not acknowledge or resolve Alertmanager’s member alerts. Alertmanager remains the source of truth for whether its alerts are firing or resolved.
WarnFire changes only fingerprints that Alertmanager explicitly includes in a
webhook. A fingerprint missing from a delivery is not assumed resolved,
even when truncatedAlerts is zero: webhook payload v4 has no delivery
timestamp or completeness guarantee. Keep send_resolved: true so each member
recovery is delivered explicitly. This safety rule can leave an incident open
when a resolution delivery is permanently lost; an authorized operator can use
Force resolve
with a recorded reason.
After force resolution, the first subsequent firing receipt creates a successor incident. Alertmanager’s unchanged scheduled repeat and a delayed retry have the same deterministic identity and cannot be distinguished, so WarnFire safely reopens on that first receipt. Further identical retries deduplicate into the successor normally.
Severity
WarnFire uses the highest recognized severity among the members currently firing:
critical > error > warning > info
warn is accepted as warning. Unknown values such as P1, sev1, and page remain in the recorded labels but do not outrank a recognized severity. If no firing member carries a recognized value, WarnFire falls back to the group’s shared severity and then to error.
Severity is recalculated only when Alertmanager sends a notification. If a critical member recovers while warnings remain, the incident becomes warning after the changed group is delivered. It does not wait for the whole group to resolve.
Delivery timing
Three route timers determine when notifications arrive:
| Setting | Alertmanager default | Meaning |
|---|---|---|
group_wait | 30s | Wait after the first member begins firing so related members can join the initial notification |
group_interval | 5m | Check an existing group for new or newly resolved members and send the changed group |
repeat_interval | 4h | Repeat an unchanged firing group |
The alert rule’s for: duration happens before these timers. A rule with for: 5m must remain active for five minutes before Alertmanager sees it as firing.
For testing, group_wait: 10s and group_interval: 30s keep the lifecycle visible without hiding changes for five minutes. Choose production values based on how quickly responders need member changes and how much notification traffic you can tolerate. Keep repeat_interval a multiple of group_interval; Alertmanager evaluates repeats on group-interval boundaries.
resolve_timeout is different. It applies when a sender does not provide EndsAt. Prometheus alerts do provide EndsAt, so changing resolve_timeout does not control ordinary Prometheus recovery timing.
See the official Alertmanager configuration reference for current defaults and complete timer semantics.
Truncated groups and max_alerts
Alertmanager’s webhook max_alerts option limits how many members appear in one delivery. The payload reports omitted members through truncatedAlerts.
A truncated delivery is not a complete picture of the group. WarnFire records
the truncation count, but you should not use a low max_alerts and then expect
omitted-member details or severity changes to be exact. Alertmanager omission
never implies member recovery—even for a non-truncated delivery—so WarnFire
changes only members Alertmanager actually delivered.
Prefer the default max_alerts: 0 unless you have measured a delivery-size problem. If you must cap it, choose a value larger than the largest group you expect and monitor truncatedAlerts.
What WarnFire records
| Incident field | Alertmanager source |
|---|---|
| Correlation | groupKey |
| Title | Shared summary, shared alertname, or a group fallback |
| Severity | Highest recognized severity among firing members |
| Description | Shared description |
| Component | Shared component, then shared job |
| Environment | Shared environment, then shared env |
| Region | Shared region |
| Links | Alertmanager URL, runbook/dashboard annotations, and member generator URLs |
| Details | Firing/resolved member counts and up to ten member summaries |
Shared fields are values Alertmanager places in commonLabels or commonAnnotations because every member agrees on them. Put a service-level summary or runbook on every rule in the group if you want it to survive as a shared incident field.
Open the incident’s Events tab to inspect each delivered group update and its recorded payload.
Verify it worked
Do not treat a quiet Alertmanager log as proof of delivery. Walk the chain:
curl -fsS localhost:9090/api/v1/targets  # Prometheus can scrape the target
curl -fsS localhost:9090/api/v1/rules    # the rule is loaded
curl -fsS localhost:9090/api/v1/alerts   # Prometheus sees it firing
curl -fsS localhost:9093/api/v2/alerts   # Alertmanager received it
Then confirm WarnFire opened the expected incident. Recover the monitored condition and confirm that the same incident resolves.
Test all three meaningful phases:
- Several related members fire in one group.
- One member resolves while another remains firing.
- The final member resolves.
That catches grouping, partial recovery, severity reduction, final correlation, and send_resolved behavior. A trigger-only test does not prove recovery works.
Use Services → Provider webhook adapters → alertmanager to preview a real payload without paging. Preview maps the action, title, severity, correlation key, and metadata; it does not select or verify a service. Choose the intended service before using Send test.
Send test and a delivery from Alertmanager use the normal incident and escalation path. They can page real responders. Selected SMS and voice channels consume allowance or prepaid credits for every destination contacted and can invoke configured auto-recharge. Notify the responder and use a dedicated test service when practical.
Troubleshooting
Several incidents open for one outage
Inspect group_by. Grouping by alertname creates one group—and therefore one WarnFire incident—per symptom. Group by the service, environment, cluster, or other unit responders handle together.
The first incident is slow to appear
Add the alert rule’s for: duration and Alertmanager’s group_wait. Verify the rule and alert through the Prometheus and Alertmanager APIs above.
A member change looks delayed
Alertmanager sends changed existing groups on group_interval boundaries. Its default is five minutes.
Incidents do not close
Confirm the receiver has send_resolved: true, reload Alertmanager, and verify the resolved notification leaves Alertmanager. Although the webhook default is currently true, an explicit false can be inherited from copied configuration.
The integration key cannot be read
Confirm the credentials file exists before the container starts, is a regular file rather than a directory, and is readable by the Alertmanager process. Mount its containing directory in Docker.
Incident links point to container names
Start Prometheus and Alertmanager with externally reachable addresses:
--web.external-url=https://prometheus.example.com
--web.external-url=https://alertmanager.example.com
HTTP errors from WarnFire
| Status | Meaning |
|---|---|
400 | Invalid payload, unsupported version/status, missing group key/fingerprint, or inconsistent resolved state |
401 | Missing, invalid, expired, or revoked integration key |
413 | Delivery exceeded the request-size limit; inspect group size before introducing max_alerts |
415 | Request was not application/json |
429 | The trigger-rate limit or maximum active-incident limit was reached. Check Limits and protections , resolve stale incidents, and then retry. |
Alertmanager retries failed webhook notifications. Fix the cause and confirm the expected incident state rather than assuming a quiet log means the retry succeeded.
Next steps
Review how Alertmanager grouping defines an incident , then use Test before you connect to preview representative groups before changing grouping or routing in production.